RAN Observability KPIs: The Complete Guide to Telecom Network Monitoring
In the complex world of Radio Access Network (RAN) operations, network engineers and NOC teams face the challenge of monitoring hundreds of KPIs across multiple dimensions. The key to effective RAN observability isn't just collecting more metrics—it's understanding which ones matter most and how they relate to the fundamental pillars of network performance.
This comprehensive guide organizes RAN observability KPIs using the classic ITU/3GPP 5-pillar framework that telecom operators worldwide rely on for systematic network monitoring and troubleshooting. Whether you're managing LTE/VoLTE networks or preparing for 5G deployments, this structured approach ensures you're tracking the right metrics at the right time.
📊 The ITU/3GPP 5-Pillar Framework
The telecom industry standard for categorizing network performance metrics into logical, actionable groups that align with business objectives and operational workflows.
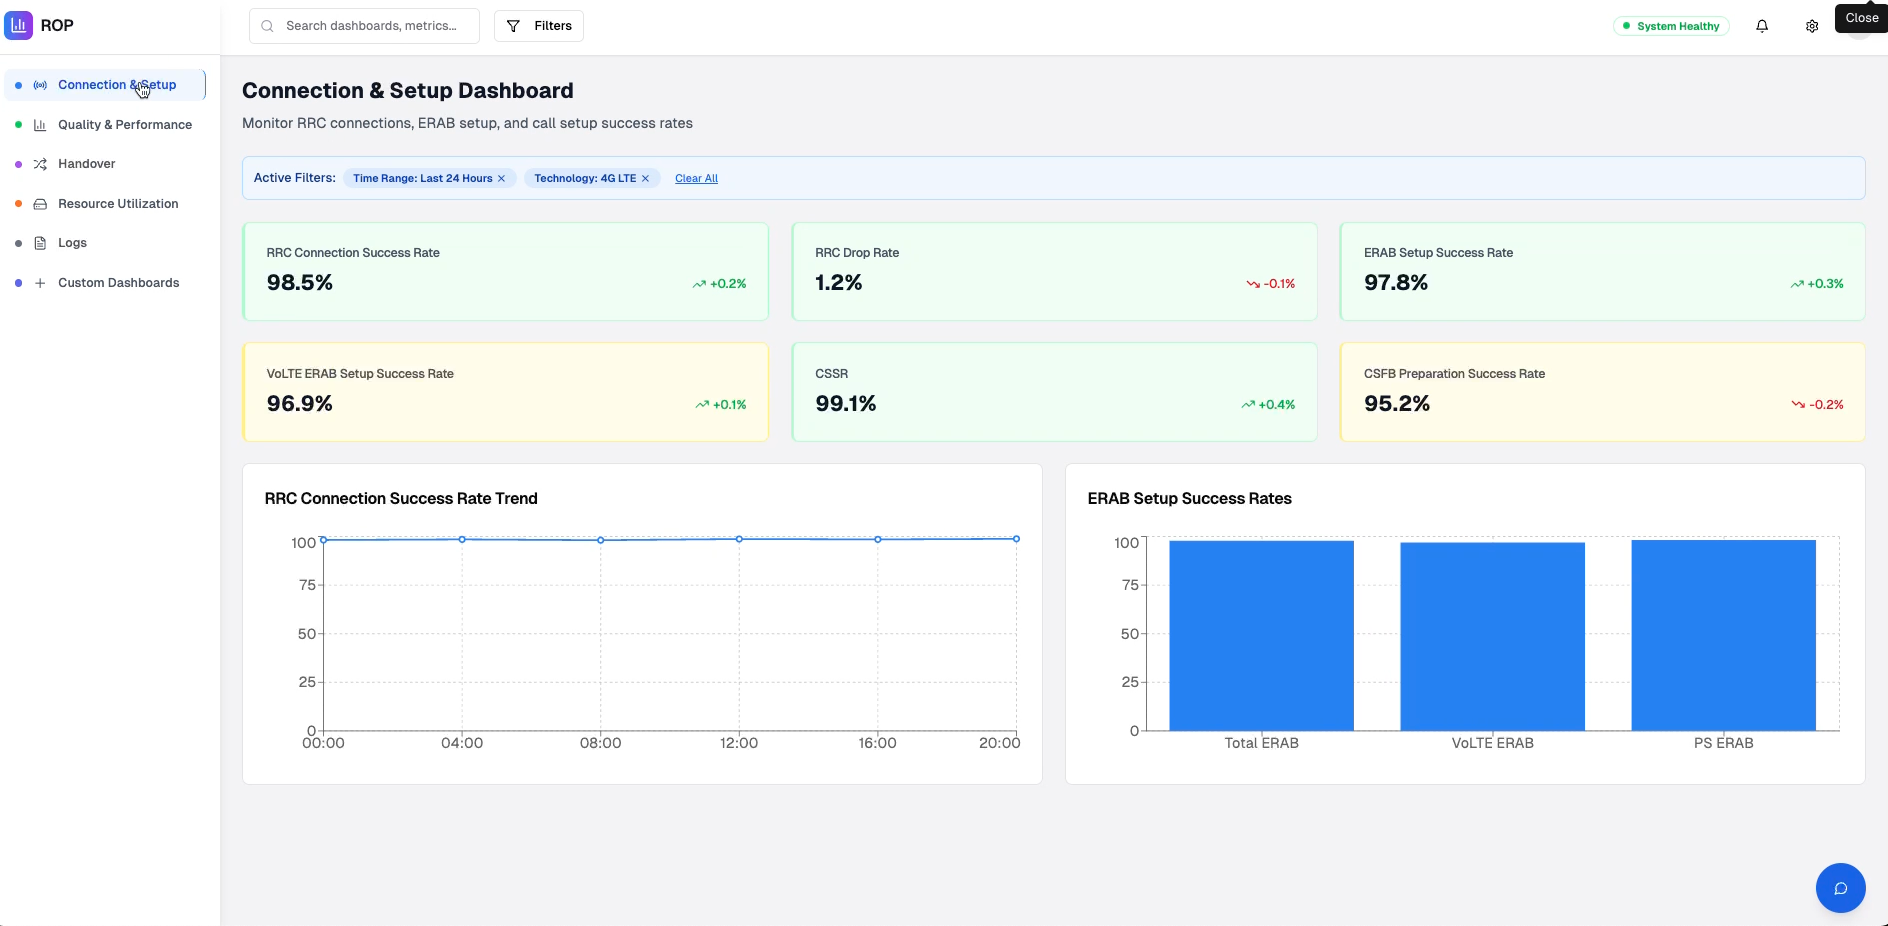
1. 📡 Accessibility KPIs - "Can Users Get Connected?"
Accessibility KPIs measure the network's ability to establish connections when users attempt to access services. These are your first-line indicators of network availability and service reachability.
RRC Connection Success Rate (All) (%)
Measures the percentage of successful Radio Resource Control connection establishments across all service types.
Target: >99% | Alert Threshold: <98%
ERAB Setup Success Rate (%)
Tracks successful establishment of E-UTRAN Radio Access Bearers for data services.
Target: >99.5% | Alert Threshold: <99%
VoLTE ERAB Setup Success Rate (%)
Specific metric for Voice over LTE bearer establishment success.
Target: >99.8% | Alert Threshold: <99.5%
CSSR (Call Setup Success Rate) (%)
Overall call establishment success rate across all voice services.
Target: >99% | Alert Threshold: <98.5%
CSFB Preparation Success Rate (%)
Success rate of Circuit Switched Fallback preparation for legacy voice support.
Target: >98% | Alert Threshold: <97%
2. 🔒 Retainability KPIs - "Can Users Stay Connected?"
Retainability KPIs track the network's ability to maintain active connections once established. These metrics are critical for user experience and directly impact customer satisfaction scores.
RRC Drop Rate (%)
Percentage of Radio Resource Control connections that are unexpectedly terminated.
Target: <0.5% | Alert Threshold: >1%
Drop Rate % (General Voice/Data)
Overall connection drop rate across all service types and user categories.
Target: <1% | Alert Threshold: >2%
ERAB Drop Rate - PS (%)
Packet Switched bearer drop rate for data services.
Target: <0.8% | Alert Threshold: >1.5%
ERAB Drop Rate - VoLTE (%)
Voice over LTE bearer drop rate - critical for voice service quality.
Target: <0.3% | Alert Threshold: >0.8%
3. 🚀 Mobility KPIs - "Can Users Move Between Cells Seamlessly?"
Mobility KPIs ensure users experience uninterrupted service while moving through the network. These metrics are essential for maintaining service continuity and preventing call drops during handovers.
Intra Frequency HO Out Success Rate (%)
Success rate of handovers between cells on the same frequency.
Target: >99% | Alert Threshold: <98%
VoLTE Intra Frequency HO Out Success Rate (%)
Voice-specific handover success rate within the same frequency.
Target: >99.5% | Alert Threshold: <99%
Inter Frequency HO Out Success Rate (%)
Success rate of handovers between different frequencies.
Target: >98% | Alert Threshold: <97%
VoLTE Inter Frequency HO Out Success Rate (%)
Voice handover success rate across different frequencies.
Target: >98.5% | Alert Threshold: <97.5%
PS Handover Success Rate (LTE Intra System) (%)
Packet Switched handover success rate within LTE system.
Target: >99% | Alert Threshold: <98%
4. 🎯 Integrity / Quality of Service KPIs - "How Good Is the Connection?"
Integrity KPIs measure the quality and reliability of the data transmission, directly impacting user experience and service satisfaction.
Packet Drop Rate (DL)
Downlink packet drop rate across all services.
Target: <0.1% | Alert Threshold: >0.5%
Packet Drop Rate (DL) – VoLTE
Voice-specific downlink packet drop rate.
Target: <0.05% | Alert Threshold: >0.2%
Packet Drop Rate (DL) – PS
Packet Switched downlink packet drop rate.
Target: <0.15% | Alert Threshold: >0.6%
E-UTRAN IP Latency (msecs)
End-to-end IP latency across the E-UTRAN network.
Target: <20ms | Alert Threshold: >50ms
Average Cell Throughput (DL/UL) Mbps
Average data throughput per cell in both directions.
Target: >50 Mbps DL, >25 Mbps UL | Alert Threshold: <25 Mbps DL, <10 Mbps UL
5. ⚡ Resource Utilization KPIs - "How Efficiently Are Network Resources Used?"
Resource utilization KPIs help optimize network efficiency and capacity planning by monitoring how effectively network resources are allocated and used.
PRB Utilisation DL (%)
Physical Resource Block utilization in downlink direction.
Target: 60-80% | Alert Threshold: >90% or <30%
PRB Utilisation UL (%)
Physical Resource Block utilization in uplink direction.
Target: 40-70% | Alert Threshold: >85% or <20%
PRB Utilisation DL – VoLTE (%)
Voice-specific downlink resource utilization.
Target: 20-40% | Alert Threshold: >60% or <10%
PRB Utilisation UL – VoLTE (%)
Voice-specific uplink resource utilization.
Target: 15-35% | Alert Threshold: >55% or <8%
6. 📈 Traffic / Volume KPIs - "Network Usage Patterns"
Traffic volume KPIs provide insights into network usage patterns, capacity requirements, and revenue-generating activities.
Data Volume DL (MB)
Total downlink data volume transferred across the network.
Use Case: Capacity planning, revenue analysis, network optimization
Data Volume UL (MB)
Total uplink data volume transferred across the network.
Use Case: Upload service monitoring, content creation analysis
🎯 Implementing RAN Observability: Best Practices
To maximize the value of these KPIs, consider these implementation strategies:
- Real-time Monitoring: Set up automated alerts for critical threshold breaches
- Correlation Analysis: Link KPI degradations across different pillars to identify root causes
- Historical Trending: Track KPI performance over time to identify patterns and predict issues
- Geographic Mapping: Correlate KPI performance with cell locations and coverage areas
Effective RAN observability isn't about monitoring more metrics—it's about monitoring the right metrics with the right context at the right time.
🚀 The Future of RAN Observability
As networks evolve toward 5G and beyond, the fundamental principles of the 5-pillar framework remain constant. However, new technologies like network slicing, edge computing, and AI-driven automation will require additional KPIs and more sophisticated correlation analysis.
The key to success is building a flexible observability platform that can adapt to new requirements while maintaining the structured approach that makes complex networks manageable and understandable.
Conclusion
By organizing RAN observability KPIs using the proven ITU/3GPP 5-pillar framework, network operators can achieve systematic, comprehensive monitoring that aligns with industry best practices. This structured approach ensures that critical metrics are never overlooked while providing the context needed for effective troubleshooting and optimization.
Remember that the most effective observability strategy combines automated monitoring with human expertise. Use these KPIs as your foundation, but always consider the broader network context and business impact when making operational decisions.
Whether you're managing a small enterprise network or a nationwide telecom infrastructure, this framework provides the foundation for building a robust, scalable RAN observability strategy that grows with your network and your business.